Article
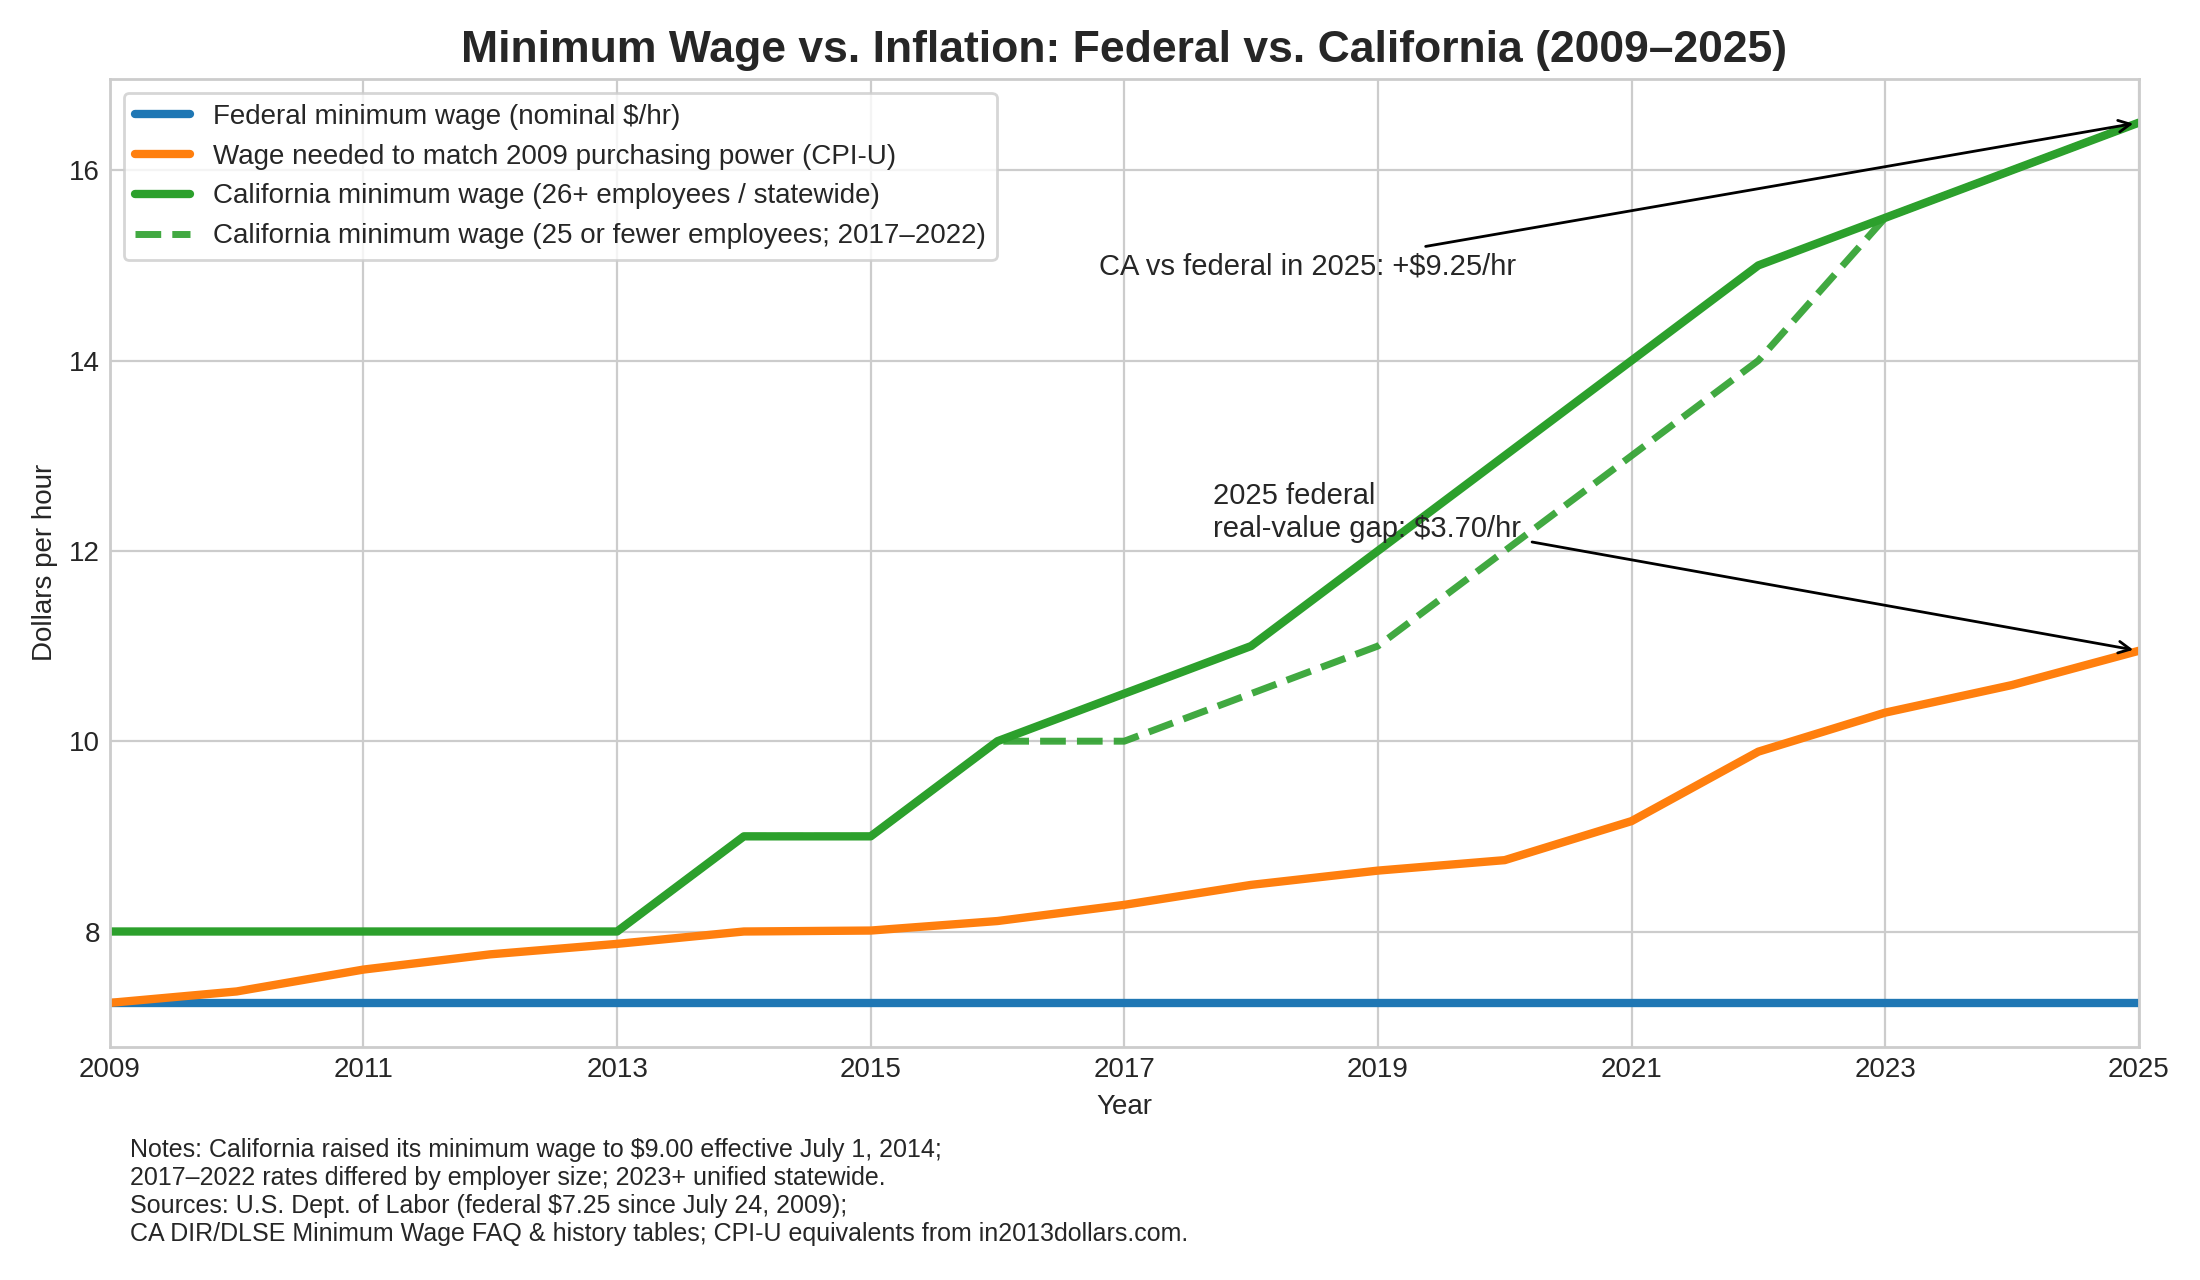
The U.S. federal minimum wage is $7.25 per hour, and it has been unchanged since 24 July 2009. That matters because when the wage floor remains flat while prices rise, the “minimum” becomes an ever-smaller share of what it takes to live.
Inflation has sharply reduced the real purchasing power of $7.25 since 2009: using CPI-based inflation calculations, $7.25 in 2009 buys roughly what ~$10.95 buys in 2025 (about a ~51% price increase over that period). Put differently: even where federal Law sets the floor, the floor has effectively sunk.
Congress has repeatedly considered raising that floor, with proposals such as the Raise the Wage Act of 2025 aiming to phase in a $17/hour minimum wage by 2030, which could significantly affect the economic stability and upward mobility of low-wage workers.
How many workers are we talking about, and what are the implications for their long-term economic mobility and ability to access future opportunities?
National Snapshot (mid‑2025)
In July 2025, the U.S. household survey counted 163.106 million employed people (this measure includes wage/salary workers as well as many self-employed categories). That’s the broad “employed” base within which low-wage work exists.
Recognizing that ~30% of U.S. workers earn less than $20/hour should prompt policymakers and researchers to take responsibility for the widespread Impact of low wages on economic stability.
California Employment Snapshot (mid‑2025)
California’s labor market is enormous and diverse. In July 2025, California’s estimated employment (household measure) was 18.762 million.
Using the same “under $20/hour” threshold, 24% of California workers fall into the $20 or less category. Two practical ways to translate that percentage into “how many people”:
· All employed Californians (including self-employed):
18.762 million × 24% ≈ 4.503 million (rounded).
· Paid workers (wage/salary), excluding most self-employed:
PPIC estimates that 89% of California workers are wage/salary and 11% are self-employed.
18.762 million × 89% ≈ 16.698 million paid workers; then
16.698 million × 24% ≈ 4.008 million paid workers under $20/hour—very close to the ~4.0 million figure shown in the state ranking table for California.
For additional labor-market composition context: BLS’s “Economy at a Glance” series shows that California had approximately 2.713 million government jobs (payroll measure) in July 2025 and approximately 18.007 million total nonfarm payroll jobs. That implies approximately 15.294 million private nonfarm payroll jobs (total minus government), consistent with “about 15–16 million” private-sector scale discussions.
Definitions: “low-income,” “low wage,” and why the labels matter
1) Low-wage work (wage-based definitions)
There is no single universally accepted definition of “low-wage work.” The BLS has explicitly noted that defining low-wage work using different hourly cutoffs changes the size and composition of the population captured.
Common approaches include:
- Relative threshold: Some studies define low-wage workers as those earning less than two-thirds of the median hourly wage (typically among prime-age workers).
- State-specific “low-wage threshold” tools: For California, UC Berkeley Labor Center’s explorer notes that (in 2022 dollars) the low-wage threshold was $19.69, illustrating that “low wage” can sit close to today’s $20/hour marker.
2) Low-income (income- and household-based definitions)
“Low-income” usually refers to household resources relative to needs—often defined by poverty guidelines or the cost of living. Policy and research commonly employ thresholds, such as near-poverty (e.g., 150% of the federal poverty line), or other eligibility cutoffs, for safety-net programs.
A key point: wages and income are not the same. A $19/hour job can be “low wage,” but a worker’s household may or may not be “low income,” depending on:
- hours worked,
- number of earners,
- dependents,
- housing costs,
- health costs,
- and local prices.
What does “$20/hour” mean in terms of living costs? Recognizing that many workers face unstable hours, high housing costs, and multiple jobs should evoke empathy and foster a shared understanding among policymakers and advocates of the underlying challenges behind the numbers.
A simple annualization is tempting: $20/hour × 40 hours/week × 52 weeks ≈ = $41,600 pre-tax. But real life rarely matches that spreadsheet:
- Many low-wage workers are part-time, seasonal, or experience variable scheduling.
- Some workers patch income by holding multiple jobs; nationally, the BLS reports ~8.431 million multiple jobholders in 2024, about 5.2% of employed people on an annual-average basis.
- In high-cost states, “rent eats first.” California renter stress is unusually high relative to other states, and PPIC notes that many renters pay 50% or more of their income toward housing in the most pressured circumstances.
- Harvard’s 2025 housing outlook emphasizes that high rents and ownership costs keep cost burdens elevated and contribute to broader instability, including homelessness pressures.
Bottom line: In much of California—mainly coastal metros—$20/hour can still be a subsistence wage if hours are unstable and housing costs remain high, highlighting the need for targeted regional policies.
Understanding how people earning low wages live reveals a complex array of coping strategies-some resilient, others risking long-term economic and social stability.
This is not a single story. It’s a portfolio of coping strategies—some admirable, some depressing, some damaging, many invisible.
1) Household stacking
People combine earners, roommates, and multigenerational living to spread fixed costs. High housing costs are a primary driver of this kind of “crowding” logic.
2) Two (or more) jobs, or a job + gig work
Multiple jobholding remains a persistent feature of the labor market, with millions of Americans working more than one job. For many, it’s not “ambition”—it’s risk management against schedule cuts, slow seasons, or unexpected bills.
3) Safety-net supplementation (working while receiving assistance)
A common misconception is that public assistance is mainly for the unemployed. SNAP (food assistance) supports many working households:
- CBPP estimates that ~15.7 million workers live in households that participated in SNAP in the last year (based on ACS analysis), indicating how common “working + benefits” is in low-wage sectors.
- UC Berkeley Labor Center has long documented that low wages shift costs to taxpayers through programs such as Medicaid/CHIP, SNAP, TANF, and the EITC—collectively referred to as the “public costs” of low-wage business models.
- The above represents forms of transfer payments from those with higher incomes.
4) Trading time for money (and paying hidden costs)
Long commutes to cheaper housing, informal childcare swaps, delayed medical care, and “maintenance deferral” (car repairs, dental work, preventive care) are all common patterns when budgets are tight—especially when housing cost burden exceeds 30% of income.
5) Debt and arrears
When income volatility collides with fixed bills, households fall behind on rent or rely on credit. PPIC notes significant rental stress indicators and elevated risks when households are behind on rent.
“What kind of students were in school?” — A better question
It’s understandable to look for a simple pipeline: “weak students become low-wage adults.” But the evidence points to something more complicated and more sobering:
Low-wage work includes many educational profiles
Brookings’ “Meet the Low-Wage Workforce” emphasizes that low-wage workers are not a monolith. They include:
- young adults in early jobs,
- adults without college credentials,
- adults with some college,
- and even people with degrees whose jobs pay poorly in local labor markets.
In fact, Brookings reports that, in its definition, low-wage workers constitute a substantial share of the workforce, and many are prime working age and supporting families.
Why schooling doesn’t map cleanly to wages
The BLS has noted that different low-wage definitions capture groups with other demographic and economic characteristics—meaning you can’t reliably infer a person’s “school quality” from the fact that they earn low wages. Additionally, labor markets reward job roles, not solely for “effort in school,” and some essential roles remain structurally underpaid.
So, rather than “what kind of students,” a more explanatory set of questions is:
- What constraints did they face while in school? (work obligations, unstable housing, caregiving, language barriers, disability, trauma)
- What opportunities did their schools offer? (career pathways, apprenticeships, counselors, dual enrollment, strong CTE programs)
- What local jobs were available when they graduated? (Industry mix and bargaining power matter a lot.)
“What kind of educational institution delivered people who would only find entry-level jobs?”
Here’s the key: institutions don’t “deliver” outcomes alone—systems do. Still, we can identify common institutional patterns that correlate with persistent low-wage outcomes.
1) K-12 systems that sort early and recover late
When students are tracked away from rigorous coursework early, or when remediation substitutes for acceleration, later wage outcomes can reflect a long runway of missed preparation. (This is a structural observation, not a moral judgment.) Brookings emphasizes that education is a primary source of job opportunities and that low-wage workers often face difficult roads to higher-paying work.
2) Schools that lack strong “work-linked” pathways
Students do better when schools connect learning to real labor-market value—through internships, dual enrollment, industry-recognized credentials, and apprenticeships. Brookings’ clustering framework (age, education, enrollment) is partly designed to demonstrate that enrollment in education/training alters prospects.
3) Community colleges: huge upside, uneven signaling
Community colleges can be engines of mobility, but outcomes depend heavily on the alignment of the program of study with local demand. Research syntheses consistently show that returns vary by credential type and field, and that job-linked programs (especially in technical and health fields) can materially improve earnings trajectories.
A crucial nuance: many students attend community college as “skills-builders” and may derive value even without a credential, especially in career and technical fields associated with less credential-intensive sectors. That means the “institution” isn’t necessarily failing—sometimes the measurement (credential completion only) misses the real intent and benefit.
4) Adult education and basic skills gaps
Adult literacy and numeracy proficiency matter for job mobility. NCES’ PIAAC materials describe how the survey measures adult competencies and reports national results for literacy and numeracy skills. When foundational skills are weak, workers may be excluded from training ladders and promotions, even if they are reliable and hardworking.
The fundamental drivers of “subsistence work”: not just school
To understand why millions remain under $20/hour, it helps to look beyond schooling:
· Industry composition: Retail, food service, caregiving, cleaning, warehousing, and specific admin roles employ vast numbers of people and often pay low wages, despite being essential.
· Weak bargaining power: EPI’s low-wage tracking emphasizes that low pay is widespread and linked to outdated wage floors and weakened worker bargaining power.
· Housing cost pressure: In high-cost states, even “decent hourly pay” can be erased by rent burdens. California’s high renter stress and broader national housing pressures are well-documented.
· Volatile hours: Underemployment is often about scheduling instability as much as it is about hourly rates—hence the reliance on SNAP among workers in low-paying, irregular-schedule jobs.
What would improve outcomes for workers under $20/hour?
Policy levers (macro)
- Raise and modernize wage floors: The Raise the Wage Act proposal is one blueprint (a phase-in to $17 by 2030, with changes to subminimum wages).
- Reduce benefit cliffs and administrative burden: Research and policy discussions increasingly highlight that complex eligibility and reporting requirements can undermine the effectiveness of the safety net for working families.
- Housing supply and affordability: High cost burdens are central to whether $20/hour is livable; California and national reports repeatedly point to affordability as a binding constraint.
Institutional levers (education/workforce)
- Career-connected learning in high school (paid internships, dual enrollment, CTE tied to real demand).
- Short, job-linked credentials with clear wage payoffs (and transparency about which programs do not pay off).
- Adult upskilling and basic skills supports (so training ladders are accessible to working adults).
Closing: The point of the $20/hour lens
“Under $20/hour” is not a moral category—it’s a stress marker. In mid‑2025, that marker captures tens of millions nationwide and roughly four million paid workers in California alone.
The better framing is not “what kind of students end up here,” but what mix of federal and state regulations, policies, competition, wages, hours, prices, and pathways keeps people here—and what levers move them out.